Guide · Confluence Cloud
Pie chart in Confluence Cloud: pie charts from text, free with Mermaid
Confluence Cloud does not draw Mermaid on its own. Paste a Mermaid pie block into a page and it stays a code block: readers see the labels and numbers as text, not as a pie chart. A Mermaid app draws it. With Mermaid Editor for Confluence, a free app on the Atlassian Marketplace, you type the labels and numbers and the pie chart draws next to them while you type. Below: the steps, a support tickets example to copy, how the syntax works, and the mistakes that make a slice go missing.
What Confluence Cloud does with Mermaid on its own
Confluence Cloud does not draw Mermaid itself. In our tests in October and November 2026, a ```mermaid block pasted into a page became an ordinary code block: readers see the labels and numbers as text, not the diagram. The code is kept safely, but nothing is drawn.
To see the diagram you need a Mermaid app that adds a macro to the editor, or you draw the diagram elsewhere and upload a picture. How to add Mermaid diagrams to Confluence Cloud compares those routes.
How to add a pie chart with Mermaid Editor for Confluence
Full disclosure: Dortus makes this app. The steps:
- A Confluence admin installs Mermaid Editor for Confluence from the Atlassian Marketplace. The app is free.
- Open the page in edit mode. Type
/mermaidand choose Mermaid Editor. You can also open the + insert menu in the toolbar and search for Mermaid Editor. - The editor opens with the code on the left and a live preview on the right. Click the Pie example to start from a short where-the-time-goes chart, or paste the example from this page. If you paste a block that starts with
```mermaid, the fences are removed for you. - Change the text. The preview redraws as you type. If a line is wrong, the preview says what is wrong and names the line, and that line is marked in the code.
- Click Insert diagram, or press Ctrl+Enter (Cmd+Enter on a Mac). Publish the page.
- To change it later, select the diagram in the editor and click the pencil icon. Versions in the editor brings back any of the last 20 saves.
On the page the diagram fits the width of the page. Hover over it, or tab to it, for the zoom buttons. Click it, or use Open large, to see it in a big window. SVG and PNG download the diagram for a slide or an email. In Confluence’s dark mode the diagram is drawn in Mermaid’s dark colours. A PDF export of the page shows the diagram as a picture, made when you click Insert diagram; a Word export shows the Mermaid code. The app has 12 examples to start from: flowchart, sequence, class, state, Gantt, pie, mindmap, timeline, journey, ER, architecture and kanban.
Where it lives: the app runs on Atlassian Forge. The Mermaid code is saved in the macro on the page, earlier versions and the picture for PDF export in Forge storage in your own Atlassian site, and the diagram is drawn in the browser of the person reading the page. No diagram text leaves your Atlassian site. The app does count a few actions, such as a diagram inserted, as anonymous numbers; the privacy policy lists them.
Example: support tickets by cause
A support team’s tickets for one quarter, by cause: 412 tickets in five groups. Copy it and change the labels and numbers to your own.
pie showData
    title Support tickets by cause, Q3 2026
    "Login and SSO" : 128
    "Billing questions" : 94
    "Bug reports" : 87
    "Feature requests" : 61
    "Other" : 42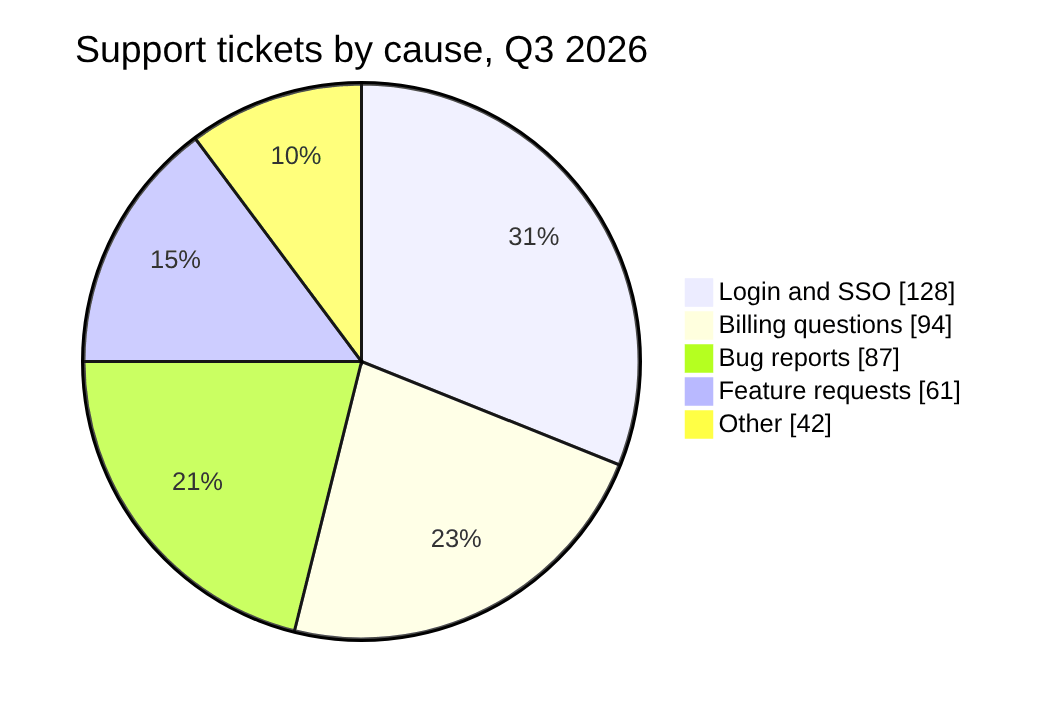
Drawn with Mermaid 12.2, the version the app uses.
How the syntax works
pieon the first line names the diagram type.showDataafter it adds the numbers to the legend, as inLogin and SSO [128].titleadds a heading. It can also go on the first line:pie title Support tickets.- Each slice is a label in double quotes, a colon and a number:
"Bug reports" : 87. - Type the counts, not the percentages. Mermaid adds them up and writes each slice’s share as a percentage, rounded to a whole number.
- A decimal number uses a point:
12.5. - Slices are drawn in the order you write them. Put the largest first if you want it to start at the top.
Let an AI assistant write the first version. ChatGPT and Claude can write Mermaid. Paste the numbers from a spreadsheet or a Jira filter, ask for a Mermaid pie chart, and paste the answer into the editor. Check that the numbers match your source: assistants sometimes round or turn counts into percentages.
Common mistakes and how to fix them
- A label without quotes.
Login : 128is an error, and the editor names the line. Fix:"Login" : 128. - A percent sign or a decimal comma.
"Login" : 31%and"Login" : 12,5are errors. Fix: plain numbers with a decimal point,31or12.5. Mermaid works out the percentages. - A negative number.
"Refunds" : -5is an error; the editor shows Mermaid’s message that negative values are not allowed. Fix: a pie chart shows parts of a whole, so use zero or more. For gains and losses, a table or a bar chart fits better. - The same label twice. Two lines called
"Login"give no error, but in our test only the first one counted and the second was left out. Fix: add the numbers up in one line, or give the lines different labels. - A very small slice. A slice under 1% of the total is not drawn; it only shows in the legend. In our test 3 out of 503 tickets left no slice. Fix: group small values into “Other”.
Other ways
Other Mermaid apps exist on the Atlassian Marketplace; the Mermaid guide lists points worth comparing. A Mermaid pie chart is drawn from numbers you type: it does not update itself. For a chart that follows live data, such as open Jira work items, use a Jira gadget or a chart app that reads the data. For a one-off chart from a spreadsheet, a picture of the spreadsheet’s chart also works.
FAQ
Can Confluence Cloud draw a pie chart from Mermaid?
Not on its own. In our tests a pasted Mermaid pie block stayed a code block. A Mermaid app such as Mermaid Editor for Confluence draws the pie chart on the page.
Do I type percentages or counts?
Counts, or any positive numbers. Mermaid adds them up and shows each slice as a rounded percentage of the total. A percent sign after a number gives an error.
How do I show the numbers next to the labels?
Write pie showData on the first line. The legend then shows each number in square brackets after its label, for example Login and SSO [128].
Why is one of my slices missing?
Two common causes: the slice is under 1% of the total, which Mermaid does not draw, or the same label appears twice, in which case only the first line counts.
Can the pie chart update from Jira data?
No. The chart shows the numbers you type in the code. To change it, edit the diagram and change the numbers. For a chart that follows live Jira data, use a Jira gadget or a chart app that reads the data.
By diagram type
A pie chart shows the parts of one whole. Mermaid diagram examples for Confluence has a short example of each of twelve diagram types. Guides that go deeper on one type:
- Gantt charts in Confluence Cloud
- Sequence diagrams in Confluence Cloud
- Mind maps in Confluence Cloud
- ER diagrams (entity relationship) in Confluence Cloud
- Class diagrams in Confluence Cloud
- State diagrams in Confluence Cloud
- Timelines in Confluence Cloud
- Flowcharts in Confluence Cloud
Questions
An example that does not draw for you, or a mistake we missed? Email support@dortus.com.
Mermaid Editor for Confluence by Dortus
Type the diagram, watch it draw
A Confluence macro with Mermaid code on the left and a live preview on the right. The code stays in the page, so the diagram stays editable. Runs on Atlassian Forge.
See also: How to add Mermaid diagrams to Confluence Cloud (including diagrams from ChatGPT or Claude)